Bellabeat Case Study

In this case study, I have analyzed data obtained from Kaggle to identify common patterns and trends in how customers use their fitness trackers. R was used for the analysis and visualizations.
Background
Bellabeat, founded in 2013, is a high-tech company that manufactures health-focused smart products and has positioned itself as a tech-driven wellness company for women. Collecting data on activity, sleep, stress, and reproductive health has allowed Bellabeat to empower women with knowledge about their own health and habits.
Bellabeat is a successful small company, but they have the potential to become a larger player in the global smart device market. The cofounder and Chief Creative Officer believes that analyzing smart device fitness data could help unlock new growth opportunities for the company.
Business Task
Analyze smart device data to gain insight into how consumers are using non-Bellabeat products. To do this the below three questions are asked:
The data is personal fitness tracker information from 33 Fitbit users over the period April 12, 2016 - May 12, 2016. Information tracked includes minute-level output for physcial activity, sleep monitoring, step counts. Other information such as weight logs is also included.
Data Sources and Integrity
Data was obtained from here (CC0: Public Domain, dataset made available through Mobius). The data used for the analysis was collected during the period April 12, 2016 through May 12, 2016.
The data was vetted to determine whether it was credible by measuring it against the below criteria:
The following issues and concerns were noted during the cleaning and analysis stages of the project:
Data Cleaning, Transformation, and Analysis
To demonstrate my ability to use R for data cleaning, transformation, and analysis, see the following link:
Visualizing the Data
R was used to create visualizations from the data. A few of them are shown below.
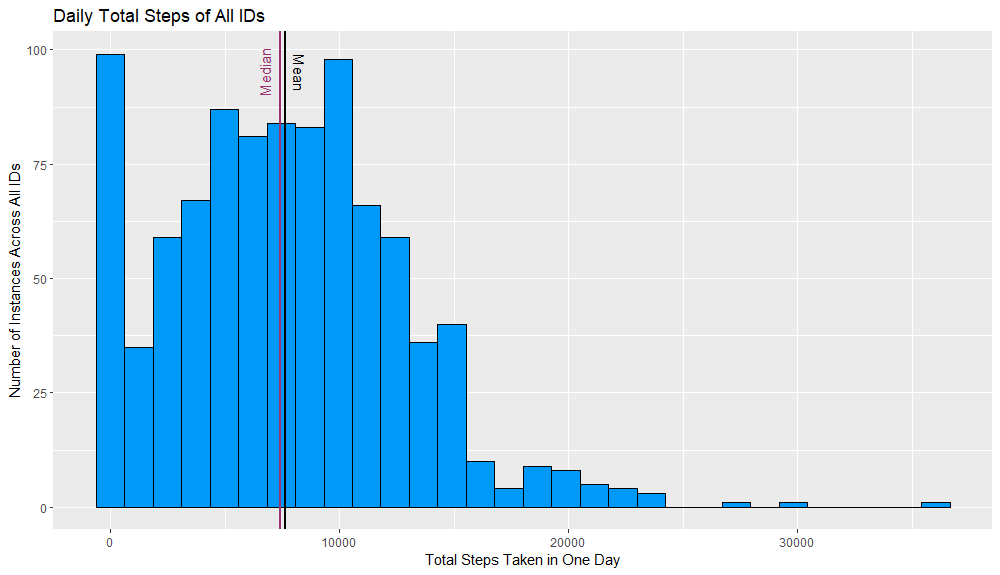
1. The mean and median values for the number of daily steps taken of all survey respondents. For variables such as "total steps" shown below, which had their mean and median close together, the mean was used for analysis.
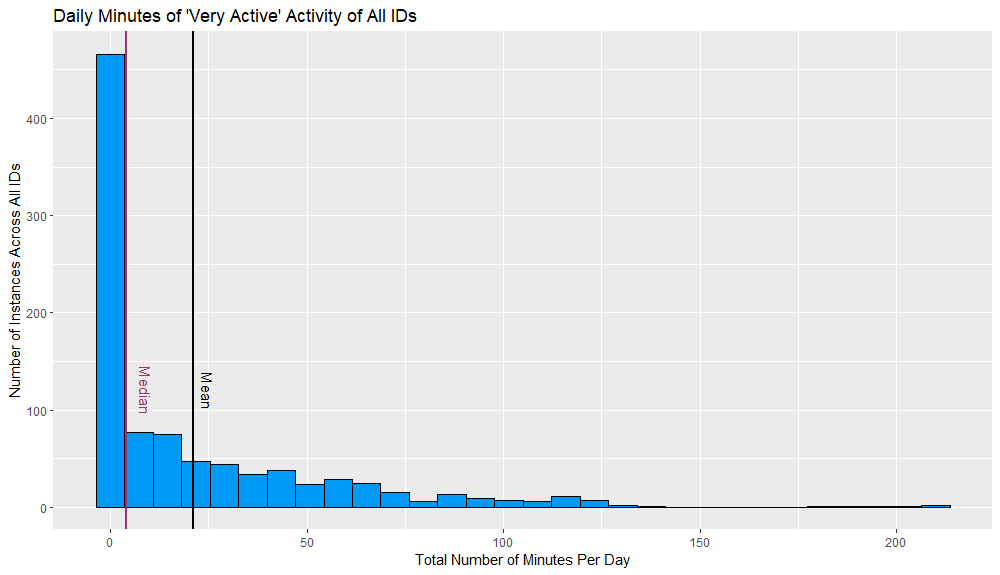
2. The mean and median values of users' physical activity minutes categorized as "very active" by Fitbit. For variables such as "very active minutes" shown below, which had a significant difference between their mean and median values, the median was used for analysis.
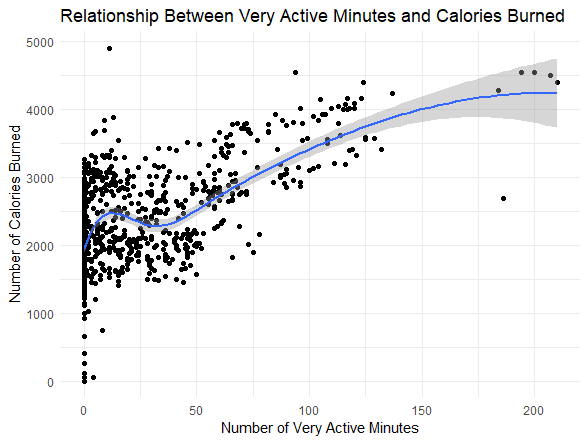
3. The relationships between the types of physical activity (very active minutes, fairly active minutes, lightly active minutes, and sedentary minutes) and number of calories burned was examined. The very active minutes variable, shown below, had the strongest correlation. This was expected since the assumption is more calories are burned with more intense forms of physical activity.
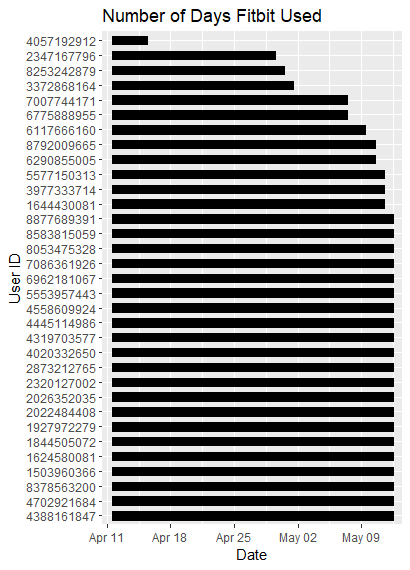
4. Many of the Fitbit users in the sample did not use their Fitbits every day. Twelve of the 33 users did not wear them each day. Of those 12, four used them for less than 10 days and one used their Fitbit for four days.
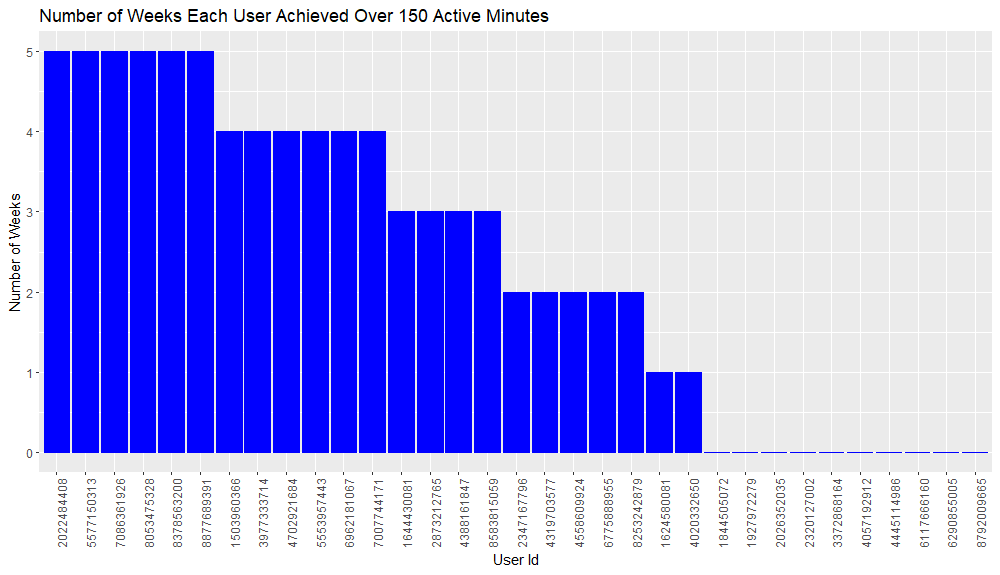
5. Twelve users met the CDC recommended guidelines for at least 4 of the 5 weeks. The CDC recommends at least 150 minutes of moderate or 75 minutes of intense physical activity each week.
Please note Week 5 is only made up of three days.
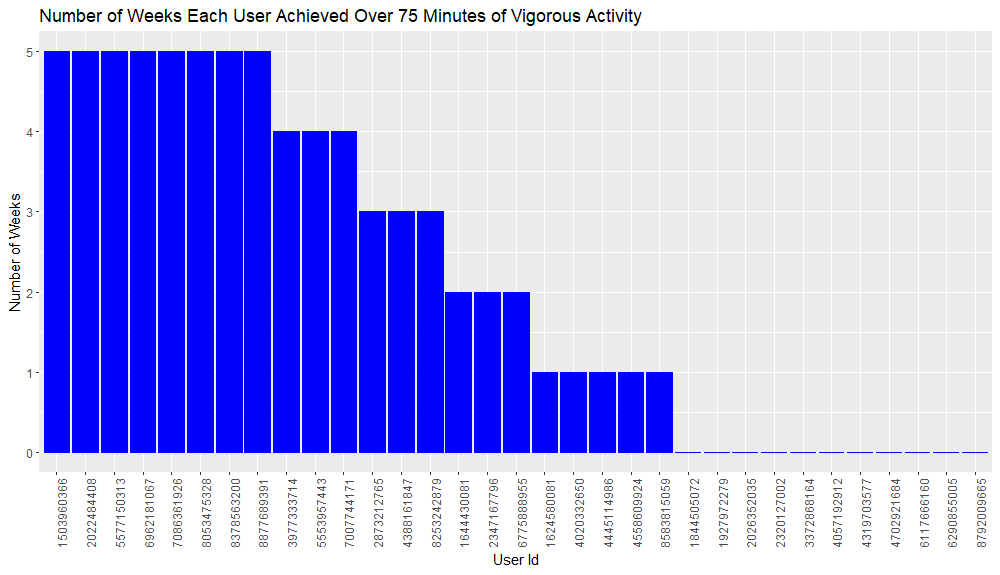
6. For eleven of the 12 users who met the recommended 150 minutes of moderate physical activity, 75 of the 150 minutes of activity was made up of intense physical activity.
Please note Week 5 is only made up of three days.
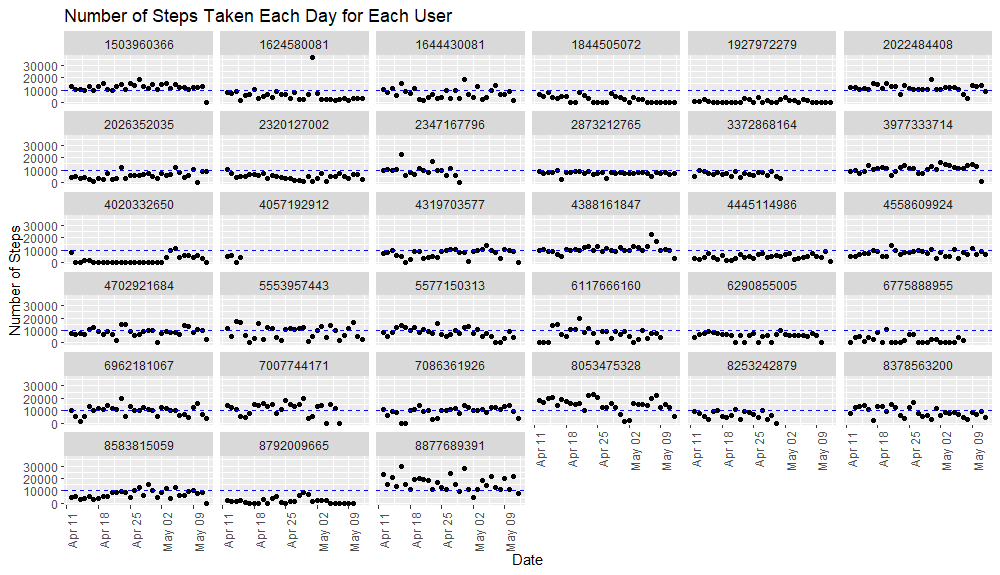
7. The consistency of steps users took each day varied widely for some. Others maintained a more even number of steps.
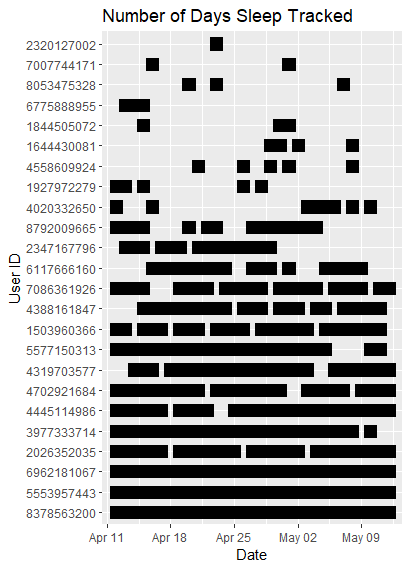
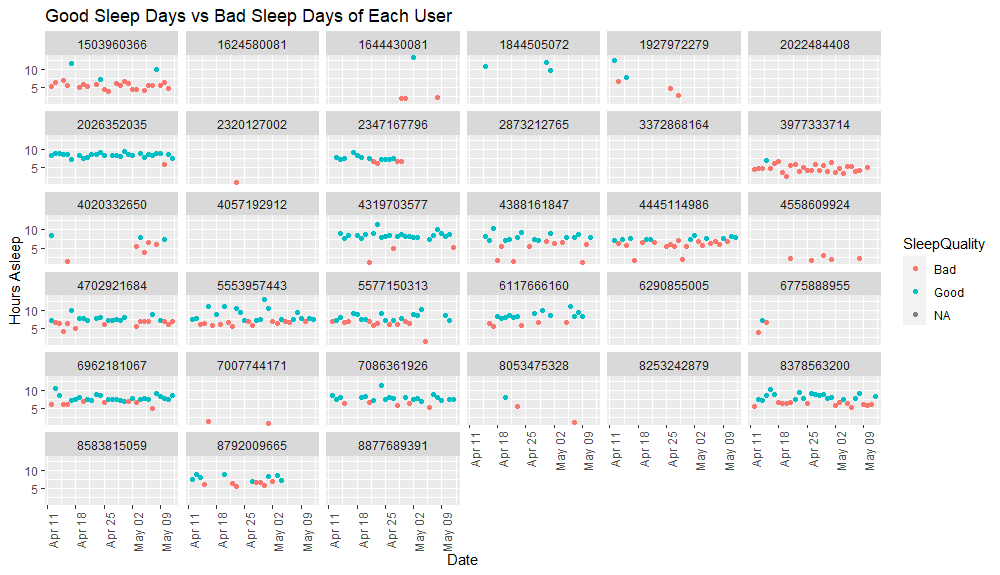
8. Nine users did not use their Fitbits to track their sleep. Nine users tracked their sleep for less than 10 days. Three users tracked their sleep for 11-20 days and 12 users for 21-31 days.
Please note during the analysis it was found the Fitbits were not accurately recording sleep times.
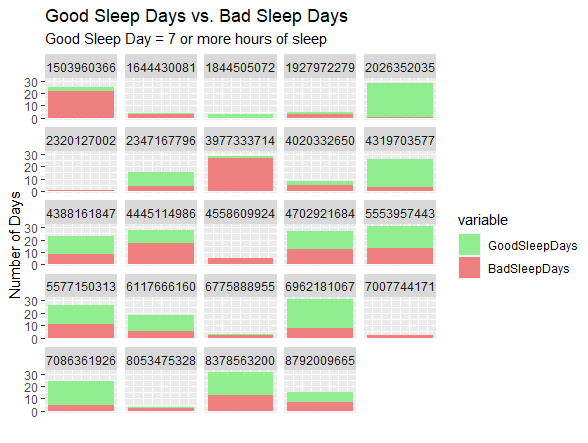
9. Many of the Fitbit users in the sample did not consistently get the CDC recommended number of hours of sleep per night for adults (at least 7 hours), defined here as 'good' sleep quality. For some, the number of 'bad' night's sleep outnumbered 'good' sleep nights.
Please note during the analysis it was found the Fitbits were not accurately recording sleep times.
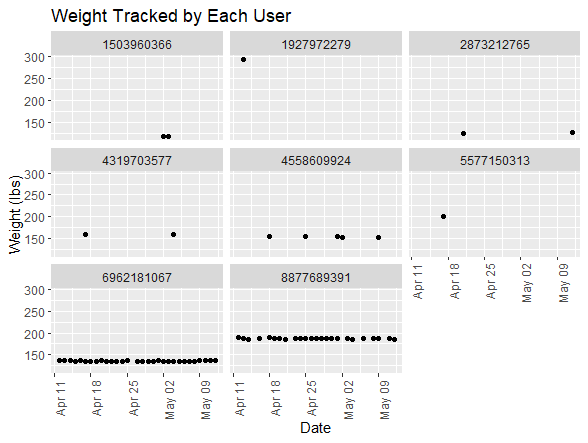
10. Two users consistenly tracked their weight, which stayed consistent during the survey time frame. Six users infrequently used their Fitbits to track their weight.
Analysis Conclusions
Recommendations
Link to stakeholder presentation
Marketing campaigns should focus on the following themes:
1. Consistency. Bellabeat’s products will keep users consistent to help them achieve their health and fitness goals. To do so, users should consistently wear the device and perform healthy activities. Bellabeat should market the following features of its products:
a. Comfort and style: Bellabeat’s devices can be worn as a necklace, bracelet, or clip depending on the user’s preference. The products are stylish, having been designed with beauty in mind.
b. Ability to motivate: the app provides more than just the user’s data. It gives insights based on the data to help users better understand their habits and make healthy decisions. Users are more likely to consistently wear the device and stay on track with their goals if their information is easy to access, relevant, and understandable.
2. Accuracy. Provide information to consumers about how their Bellabeat products provide accurate data. Bellabeat is a high-tech company and consumers expect their products to provide truthful information about their health and wellness. If users are going to invest in a fitness device, they want one they can trust to give them the most accurate information about themselves.
Impact
Further Analysis
1. Survey current Bellabeat customers to determine which features they value the most and whether there is anything they would improve, such as the type of data collected or how it is presented to them.
2. The analysis was performed over a small sample of people over a short duration of time. Determine whether data could be collected from current Bellabeat customers and from a greater population of other fitness device wearers to gain even greater insight about how customers use Bellabeat’s and other company’s products. Demographic information, such as gender, would be useful to collect as well.