Cyclistic Bike-Share Case Study

In this case study, I have analyzed data obtained from a Chicago based bike-share company to identify common patterns and trends in how their customers use the bikes differently. R, SQL, and Power BI were used.
Background
In 2016 Cyclistic launched a successful bike-share offering. Since then, the program has grown to a fleet of 5,824 bicyles that are geotracked and locked into a network of 692 stations across Chicago. The bikes can be unlocked from one station and returned to any other station in the system anytime. Pricing plans include single-ride passes, full-day passes, and annual memberships. Customers who purchase single-ride or full-day passes are referred to as casual riders. Customers who purchase annual memberships are Cyclistic members. Cyclistics marketing team has concluded that annual memberships are more profitable than casual riders. The director of marketing believes that maximizing the number of annual members will be key to future growth.
The marketing team needs to better understand how annual members and casual riders differ. Once this is determined, marketing strategies will be developed with the aim of converting casual riders into annual members.
Business Task
The marketing director has defined the goal of designing marketing strategies aimed at converting casual riders into annual members. To do this, the below three questions are being asked. The business task for this analysis is to answer the first question.
Data Sources and Integrity
Data was obtained from here and was made available by Motivate International Inc. under this license. The data used for the analysis was collected during the period May 1, 2022 through April 20, 2023.
The data was vetted to determine whether it was credible by ensuring it was:
The following issues were noted during the cleaning and analysis stages of the project:
Data Cleaning, Transformation, and Analysis
To demonstrate my ability to use both both SQL and R for data cleaning, transformation, and analysis, see the following links:
Visualizing the Data
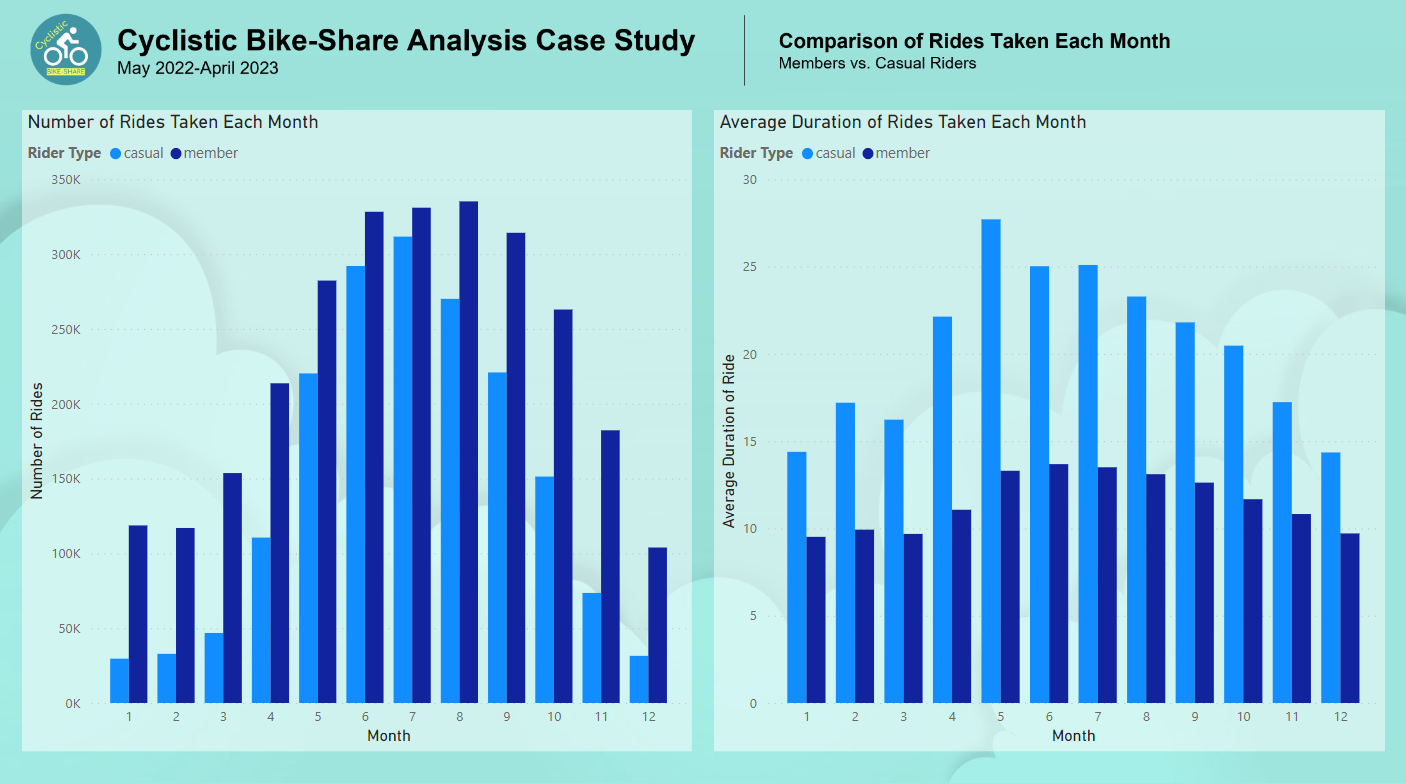
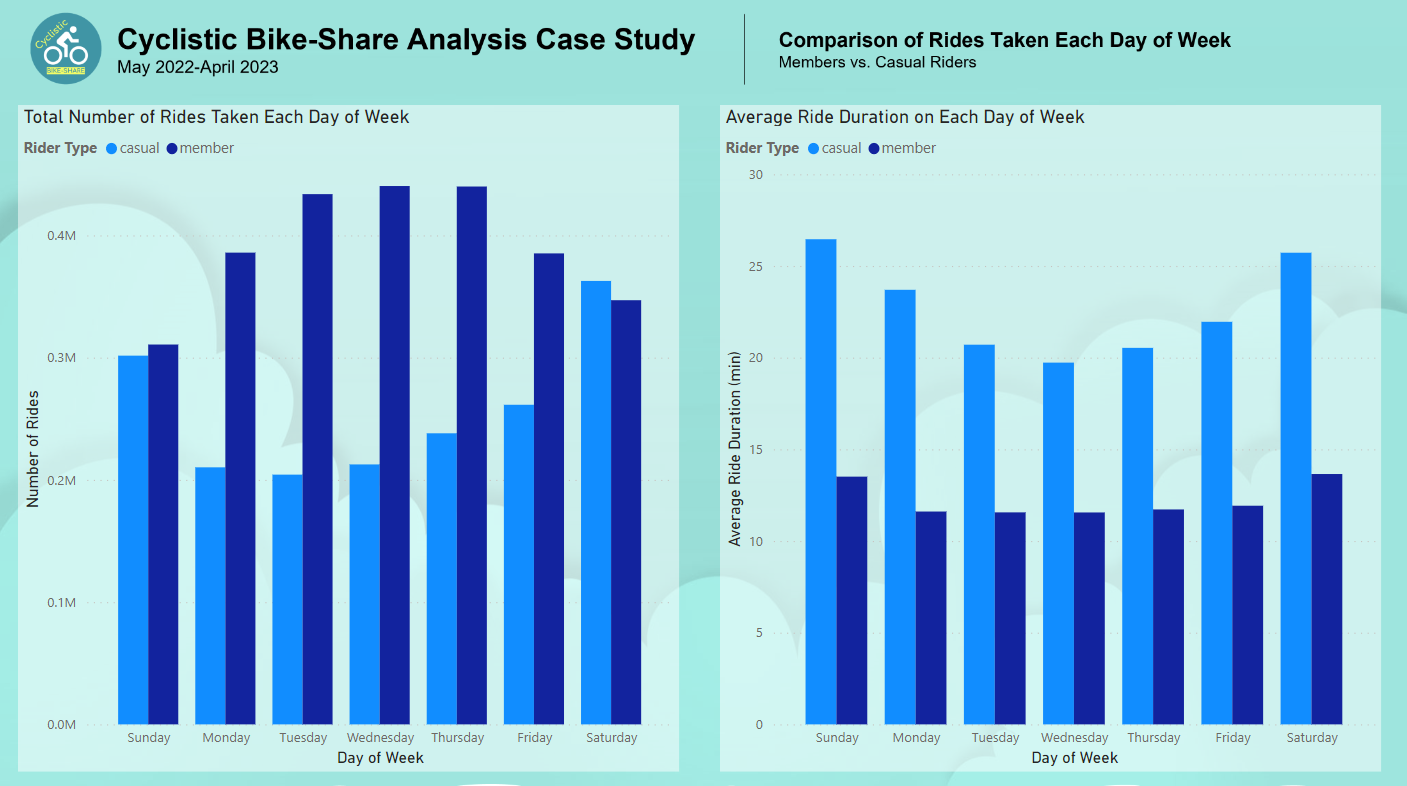
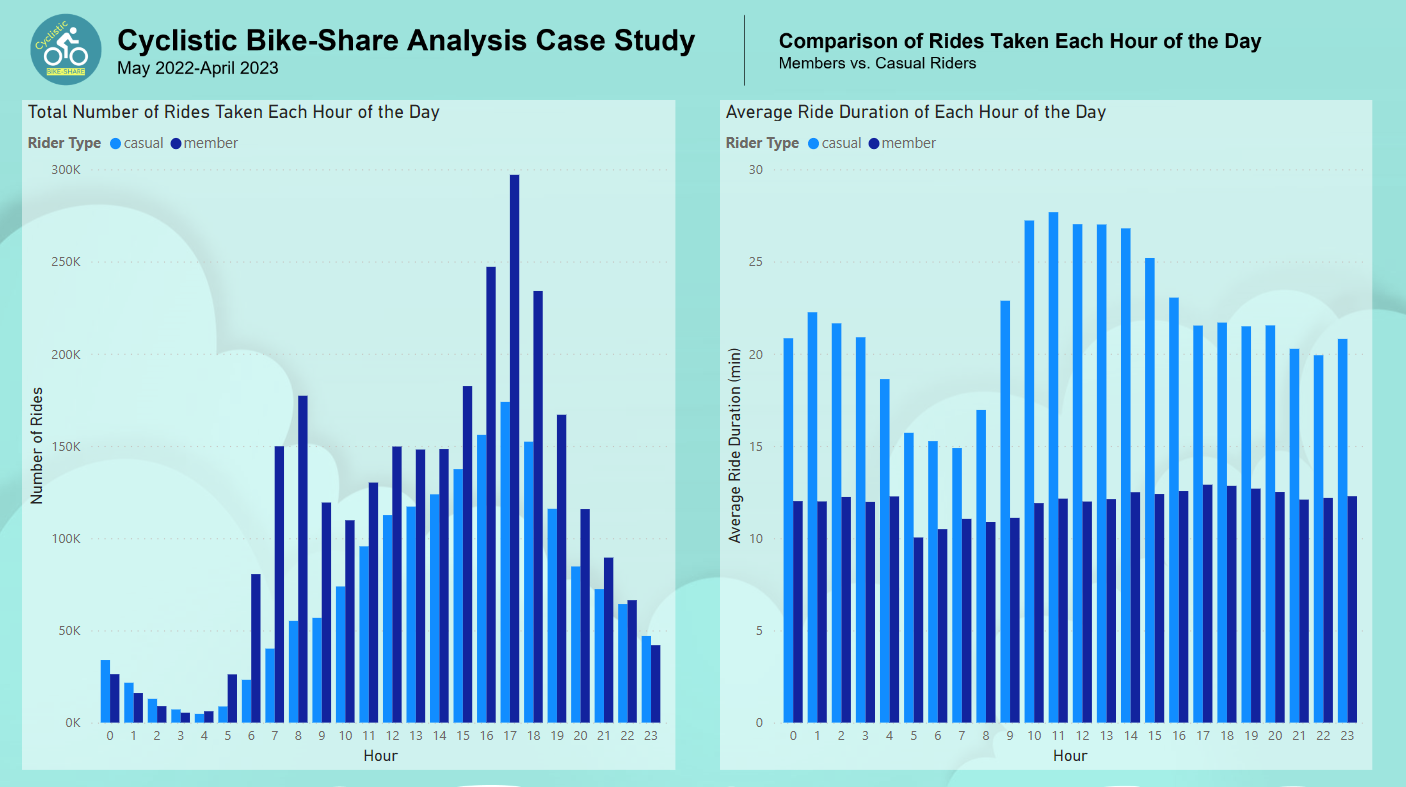
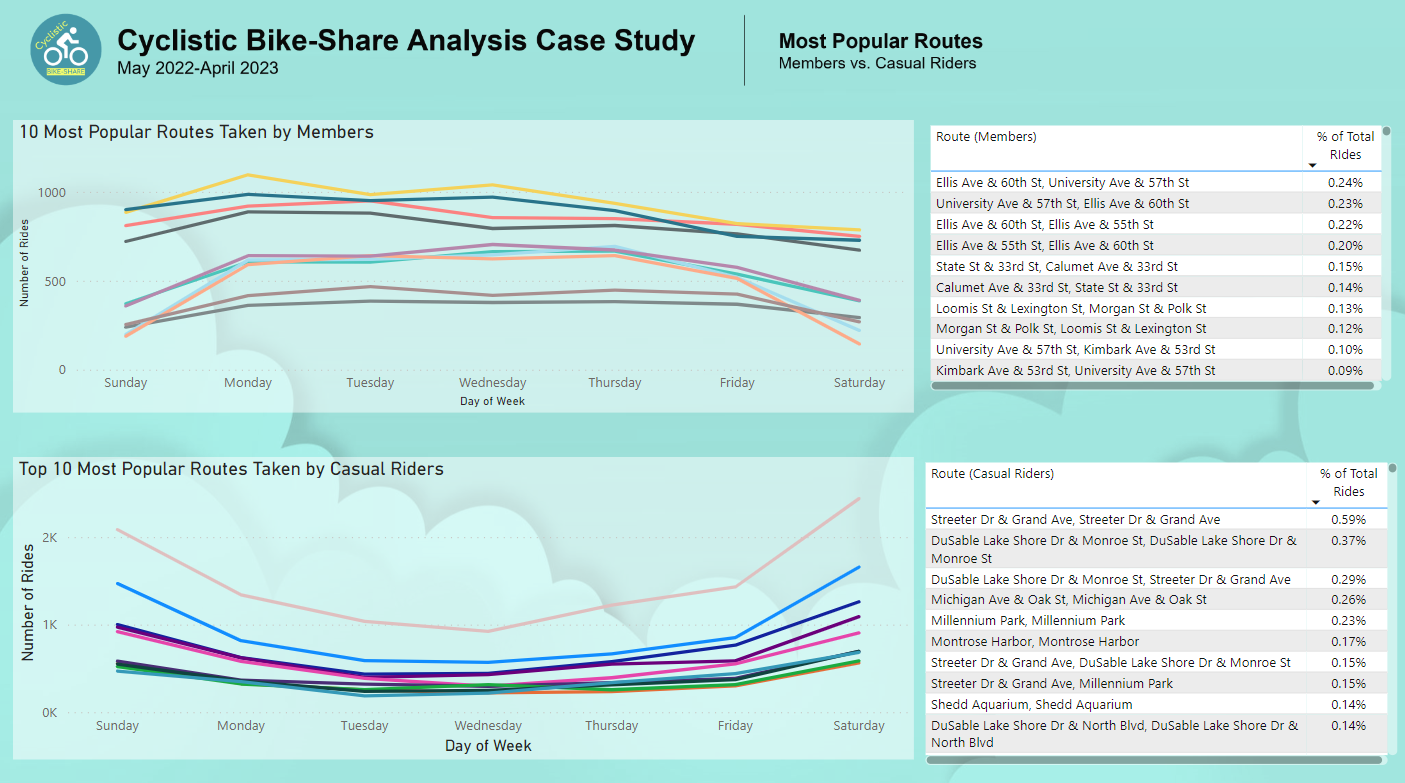
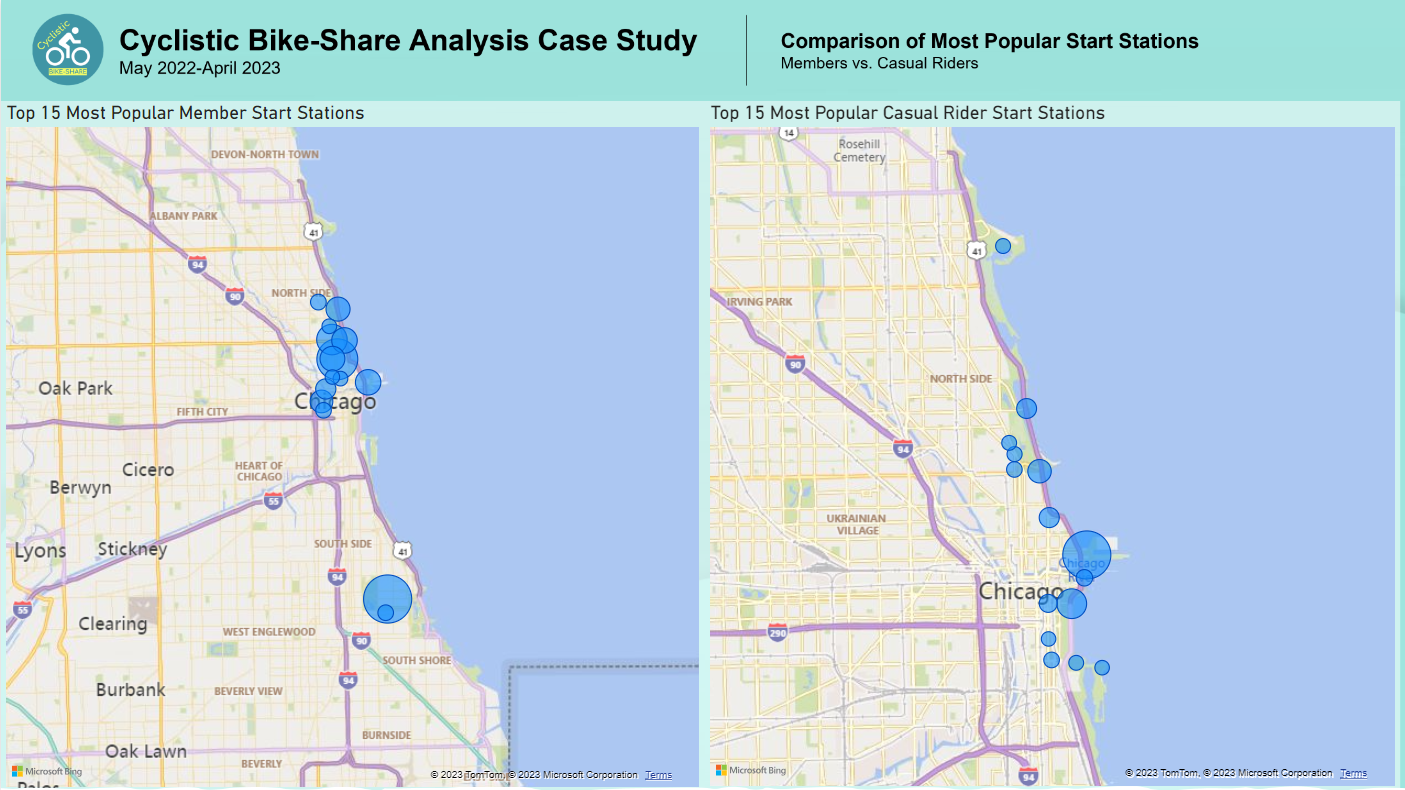
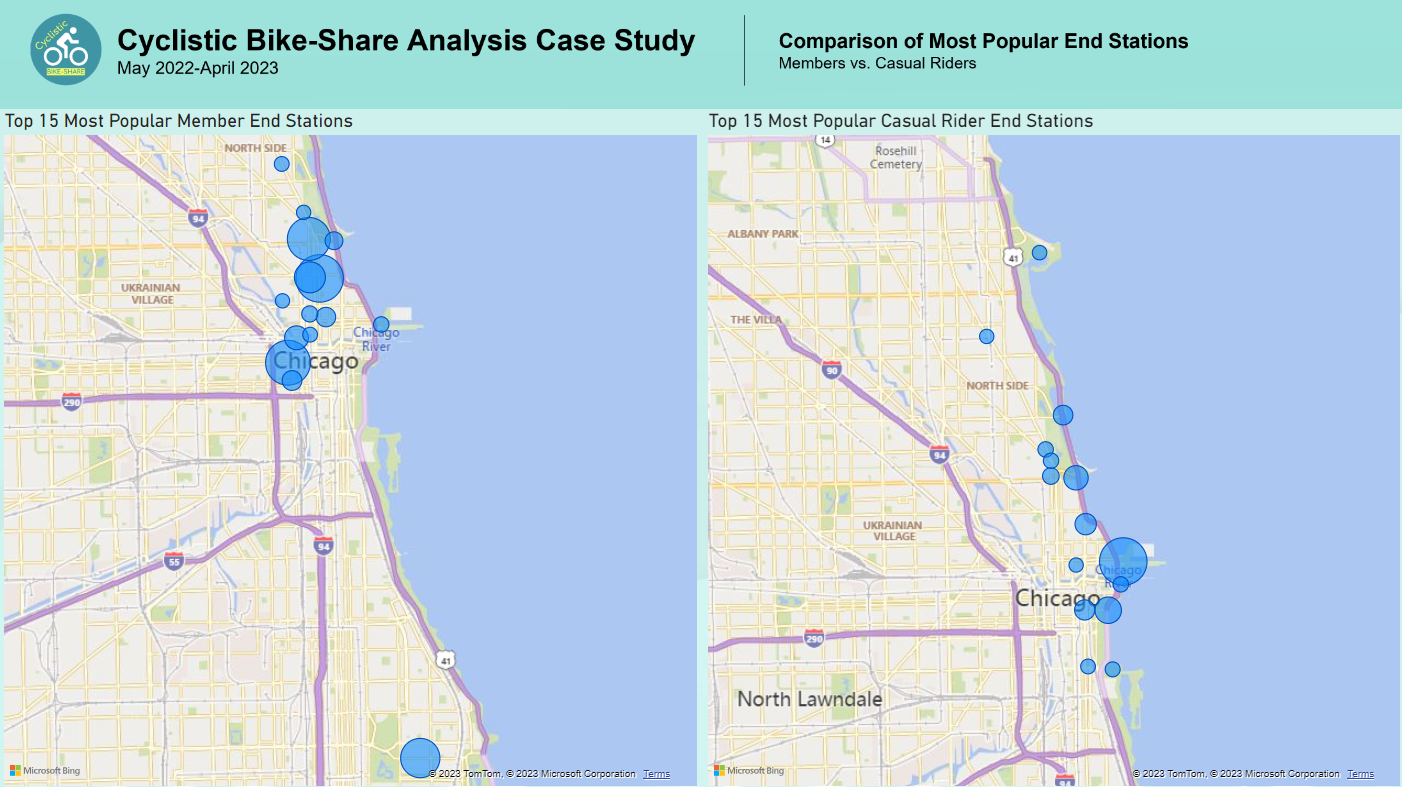
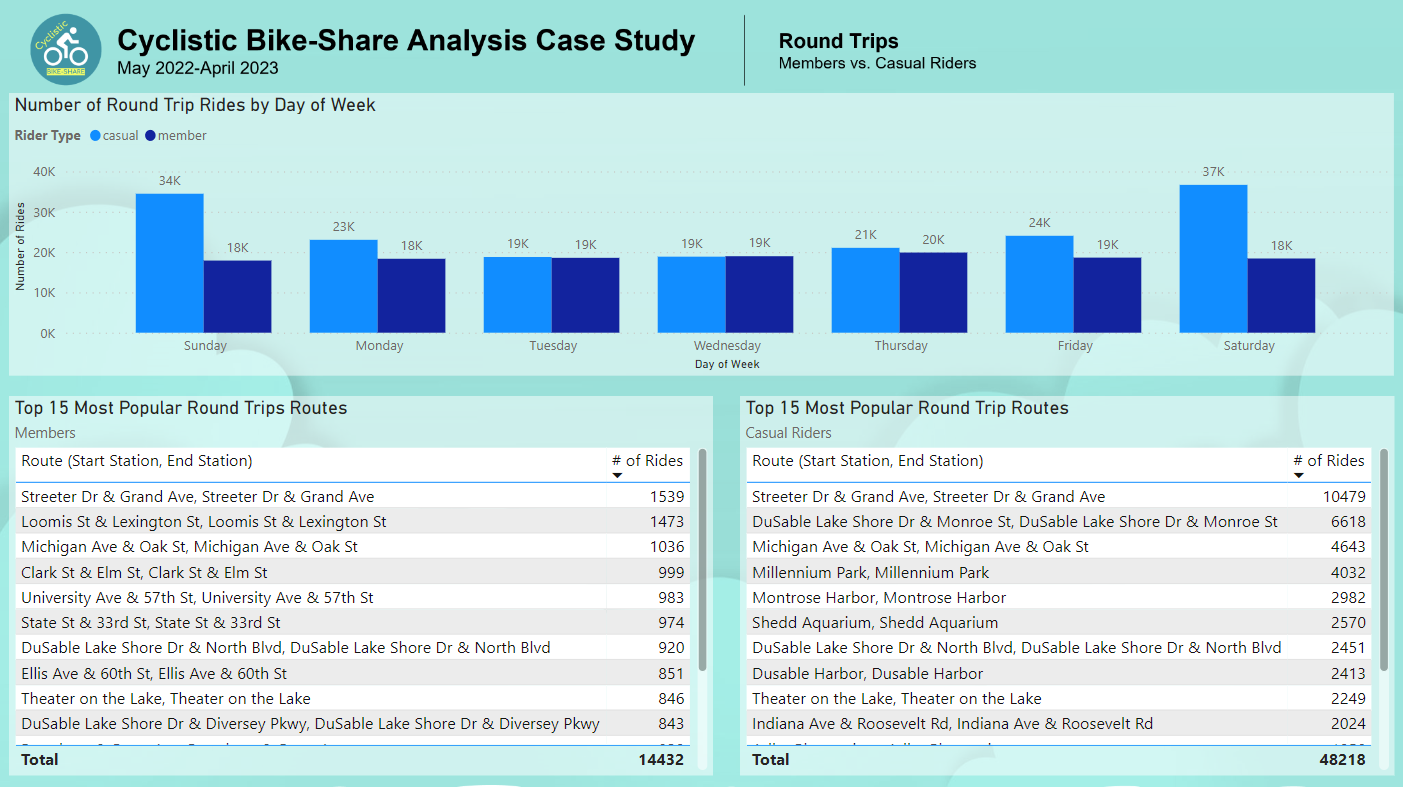
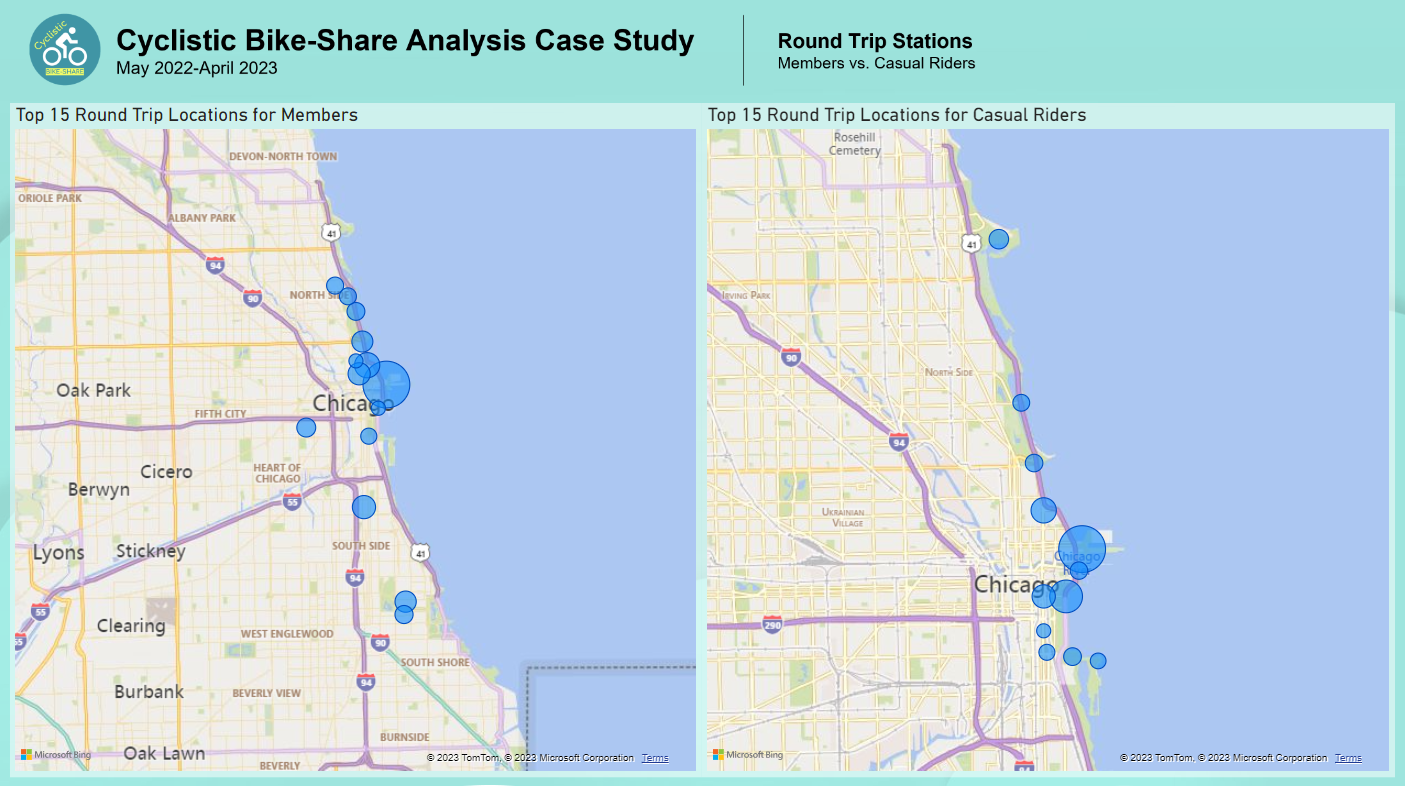
R and Power BI were both used to create visualizations from the data. The link provided to my R analysis in the above section also includes the visualizations I created. Below are screenshots of the Power BI reports created from the data which was cleaned, transformed, and exported from SQL in the previous section.

Recommendations and Next Steps
Link to stakeholder presentation
1. Casual rider use peaks during the summer months and during weekends. Offer different types of memberships catering to these trends, such as weekend and summer passes. Advertising campaigns for these types of memberships should be in the spring. Incentives could be offered for purchasing these memberships ahead of time, such as a discount for signing up one month in advance of the busy season.
2. Partner with local businesses close to the most popular stations for casual riders to offer deals with the purchase of a membership, such as discounts at restaurants, museums, and other venues.
3. Develop an app for all users which tracks their trips. Notifications containing promotional materials could be sent to frequent riders via the app.
For further analysis, determine whether all riders could be assigned a unique ID and their email addresses collected. This would allow Cyclistic to track user's trip patterns. Frequent users could be targeted for ads and promotions to persuade them to become memebrs. Surveys could also be conducted of casual riders and members. Information should be collected regarding the bike rides they are taking, including: