Not-For-Profit Dashboard

Partnered with database developers from the Office of Information Technology Services to develop an Access database that streamlined the entry of data from single audit reports and tracks progress towards issuing management decisions. Created a Power BI dashboard for visualizing the data entered into the datatabases, providing users with with real-time monitoring of submission status, findings, and management decision letter issuance. The dashboard enables trend analysis and time-based comparisons for enhanced insights.
Background
Federal regulations require state agencies to verify that each of their subrecipients have a single audit performed when the total amount of their Federal awards expended during their fiscal year equals or exceeds $750,000 (2 CFR 200.332(f)). A subrecipient is a non-federal entity that receives a subaward from another entity to carry out part of a federal program or award. The Office of Children and Family Services passes through federal funds to numerous not-for-profit (NFP) organizations as subrecipients.
Either a single audit (SA) report or an exemption form (EF) is required from each NFP. The single audit report must be uploaded to the Federal Audit Clearinghouse (FAC) no later than nine months after the close of their fiscal year. Fiscal year ends vary for the NFPs. If an NFP was not subject to the single audit requirement, they must submit a completed exemption form attesting the agency did not incur expenditures of $750,000 or more for all federal programs and is not required to have an audit of federal programs in accordance with the Code of Federal Regulations (CFR), part 200, subpart F.
For each of the NFPs which had a single audit conducted, AQC must review the report to identify whether there were any findings pertaining to an OCFS program (ex: Foster Care Title IV-E, Social Services Block Grant, Child Care and Development Fund). Each finding must also have a corrective action plan which OCFS will also review.
OCFS is required to issue a management decision for audit findings that relate to the Federal awards it makes to subrecipients (2 CFR 200.521(c)). A management decision means the pass-through entity's written determination, provided to the auditee, of the adequacy of the auditee's proposed corrective actions to address the findings, based on its evaluation of the audit findings and proposed corrective actions (2 CFR 200.0). The agency has 6 months from the date of acceptance by the FAC to issue a Management Decision.
OCFS is also responsible for tracking, reviewing and issuing management decisions for two other agencies hosted by OCFS: the Council of Children and Families (CCF) and the Office of National and Community Service (ONCS).
Essentially, it can be broked down into two requirements:
Note that all data from single audit reports is publicly available and is obtained from the Federal Audit Clearinghouse.
Data Source
A Microsoft Access database is used to enter the data used to create the reports. A connection was established between Power BI and the relevant tables in the database to enable real-time tracking and reporting of information. The relationships mapped between the tables in Power Bi was based on the Relationships Map in the database.
Submission Status Report
This report allows the user to view progress towards receiving either a single audit report or exemption form from each NFP for a particular state fiscal year. The filters can be used to view different years or to filter for only NFPs specific to a particular agency and submission type.
1. Tree Chart: Displays the total number of NFPs which have submitted a single audit report (SA), exemption form (EF), or have not submitted either.
2. Tracking Table: Groups the NFPs by FYE Date/Due Date and displays the total number of each group and the total number which submissions have been received from.
3. Gauge Chart: Displays progress towards the goal of receiving submissions from at least 95% of the NFPs.
4. Organization Name Table: A list of all NFPs based on the filters selected.
Findings Status Report
Tracking Progress Towards Issuances of Management Decisions
This report shows details about relevant (OCFS/CCF/ONCS) program findings and the progress towards issuing a Management Decision Letter for each one. Bar charts display summary information about the severity of the findings and the federal programs they pertain to.
The total number of financial statement findings, which do not require the issuance of a Management Decision Letter, is also displayed. A Bar chart displaying a summary of the severity of the financial statement findings is included.
The filters can be used to view different years or to filter for only NFPs specific to a particular agency. In the screenshot below, all years are selected.
1. Severity of Findings (Program) Bar Chart: Displays the total number of program findings by severity.
2. Federal Program Name (Program) Bar Chart: Displays the total number of program findings by federal program name.
3. Severity of Findings (Fin. Statement) Bar Chart: Displays the total number of financial statement findings by severity.
4. Program Findings Status Table: Provides information about each program finding and the progress made towards issuing a Management Decision Letter.
Findings Trends (All) Report
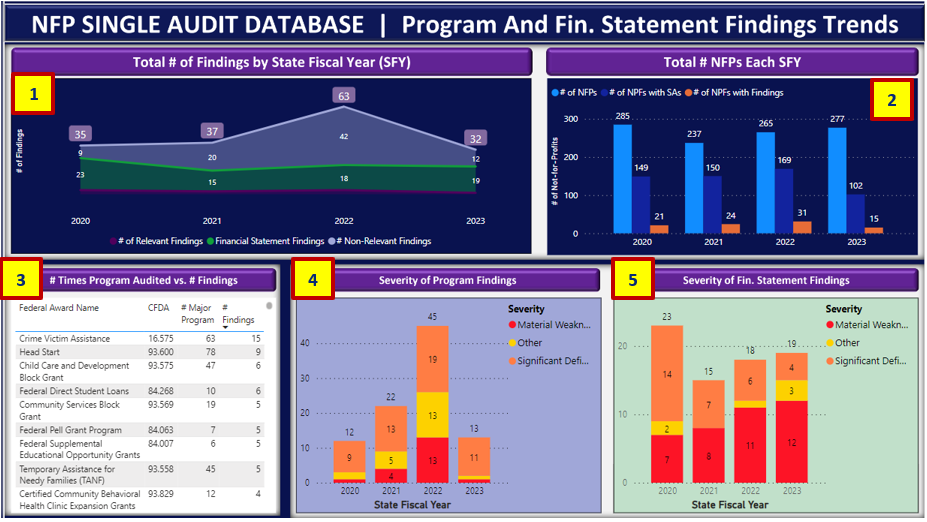
This report displays different charts and graphs to visually depict information about the number, type, and severity of all findings reported on the NFPs single audit reports. All findings, regardless of whether they are relevant to OCFS/CCF/ONCS, are included in the charts. Information such as CFDA/program name(s) the findings reference and the total number of NFPs is also displayed.

1. Total # of Findings by SFY Stacked Area Chart: Displays the total number of findings by year broken down into three groups: total number of relevant (OCFS/CCF/ONCS) findings (purple), total number of financial statement findings (green), and total number of non-relevant findings (blue).
2. Total # NFPs Each SFY Bar Chart: The total number of NFPs being tracked each year, the total number of those which submitted single audit reports, and the total number of those which had findings (financial statement or program).
3. # Times Program Audited vs. # Findings Table: Displays the total number of times a federal award program was audited and, of those, how many times there was a finding in the audit report.
4. Severity of Program Findings Stacked Bar Chart: The number of program findings for each year broken out by severity.
5. Severity of Fin. Statement Findings Stacked Bar Chart: The number of financial statement findings for each year broken out by severity.
Findings Trends (Relevant) Report
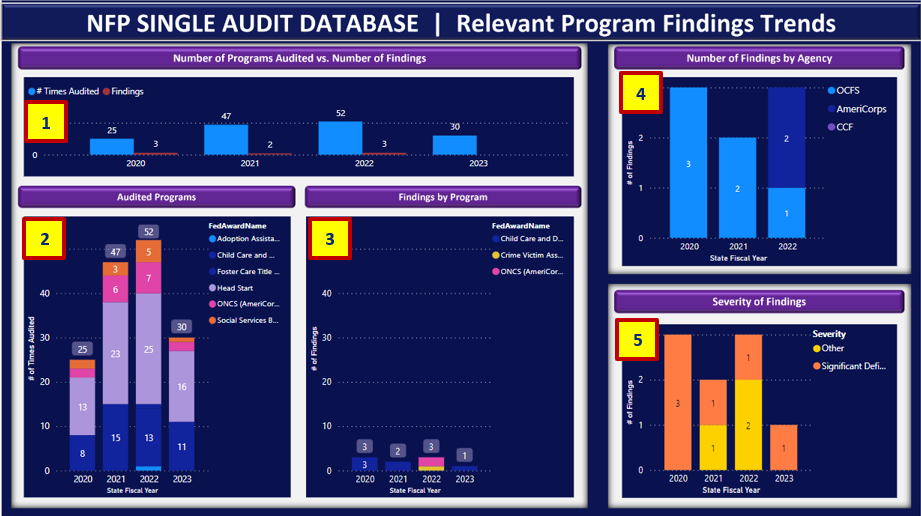
This report displays different charts and graphs to visually depict information about the number, type, and severity of relevant (OCFS/CCF/ONCS) program findings reported on the NFPs’ single audit reports.

1. Number of Programs Audited vs. Number of Findings Bar Chart: This chart displays the number of times a program was audited and the number of findings for each year.
2. Audited Programs Stacked Bar Chart: Displays how many times an OCFS program was audited as part of the NFPs’ single audit. It is broken out by state fiscal year.
3. Findings by Program Stacked Bar Chart: Displays the number of findings by federal award name broken out by state fiscal year. It can be compared to the Audited Programs Bar chart. For example, there was a finding for three of the eight times the Child Care and Development Block Grant was audited during 2020.
4. Number of Findings by Agency Stacked Bar Chart: The number of findings for each agency are displayed and broken out by state fiscal year.
5. Severity of Findings Stacked Bar Chart: Displays the number of findings by their severity: material weaknesses, significant deficiencies, or other. It is broken out by state fiscal year.